

Generating a Report
Create professional property market reports with real data in minutes.
Property market reports are at the heart of Market Trak. Each report combines real market data (average prices, demand ratings, sold prices, days on market, and more) with a professional layout that you can share with potential sellers and landlords.
How reports are created
There are two ways to create a report:
As part of a Content Pack. Type a postcode area, pick a report style, and the pack builds your report along with six matching social posts. This is the everyday route.
-
Click Content Pack in the sidebar
-
Type the postcode you want to cover and choose a report style
-
Click Generate your pack
On its own, with the Report generator. Click Report in the sidebar's Create section. Content Packs cover a postcode district (like M21) or, on paid plans, a sector (like M21 9), so use this when you need a report for a single full postcode or a town name, or when you want a report without the posts.
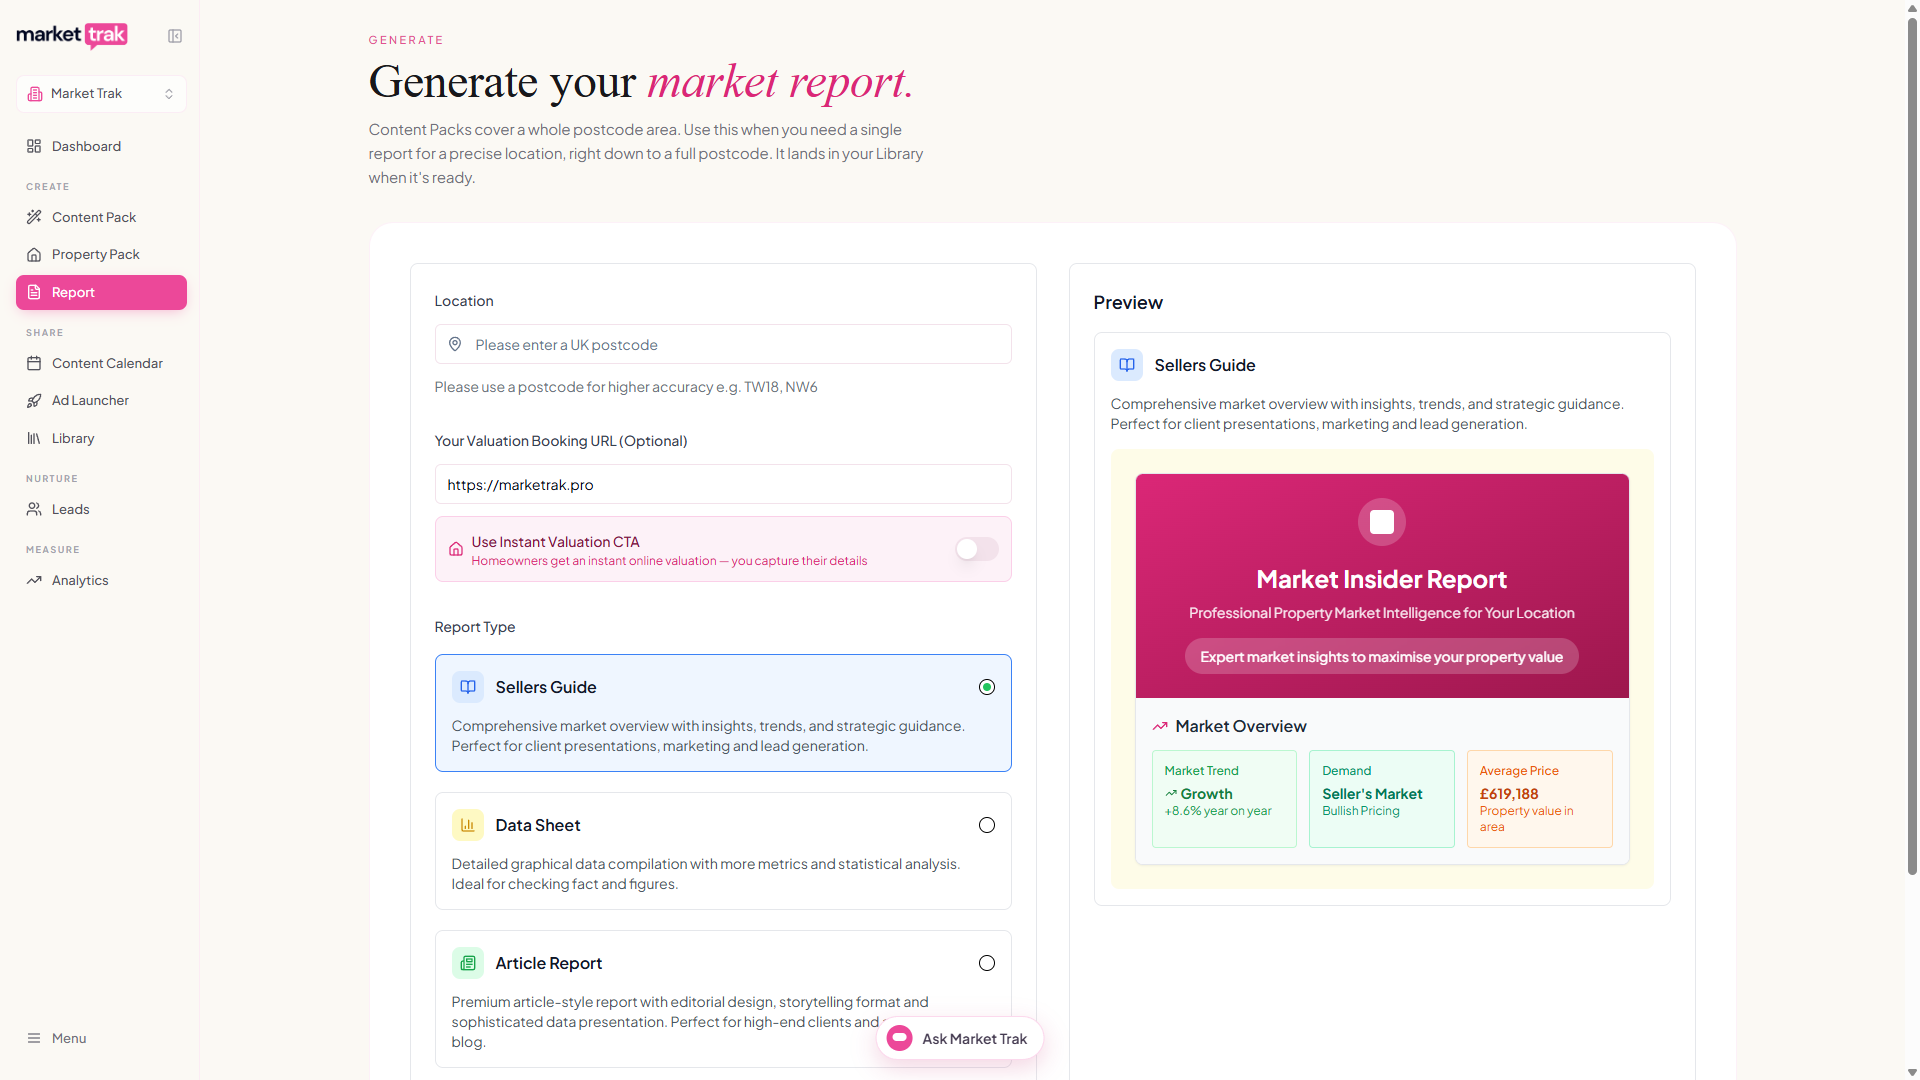
Either way, your report is ready in a couple of minutes and is saved to your Library (the Reports tab), where you can open it, copy its public link, rename it, and see its views and captured leads at a glance.
You can also ask the AI Assistant to create a report for a location.
What data is included
Each report automatically includes:
-
Average property prices for the area
-
Price change trends (rising, falling, or stable)
-
Demand rating (high, medium, or low)
-
Average days on market
-
Sales volume (transactions per month)
-
Sold prices for comparable properties
-
Price per square foot data
All data is sourced from the PropertyData API, which aggregates from Land Registry, EPC, and listing data.
How the year-on-year figure is worked out
The price change on your report measures the price per square foot across recent sales in the area, measured over a full year and set against the year before. Measuring per square foot means the figure isn't swayed by whether larger or smaller homes happened to come up for sale in a given month, so it reflects the market rather than the mix of what was on it.
The figure is labelled "per sq ft, year on year" on the report, and the price history chart is labelled "Average sold price, year by year". They measure different things, so they won't always agree: the chart follows what the average home actually sold for (which moves with the mix of homes selling), while the headline figure tracks the going rate per square foot. When the two drift apart, that gap simply means the homes selling this year were bigger or smaller than last year's.
Two things you may occasionally see:
-
"Not enough data" in place of a percentage. Some areas have too few recent sales to give a reliable read, and we would rather say so than show you a flat result that isn't really flat.
-
"Based on the wider [postcode] area" underneath the figure. If you asked for a small area such as a single postcode sector, we widen the search to its postcode district to find enough recent sales. The report tells you when it has done that, so the number you quote is always the number you can stand behind.
The average price shown on your report and this percentage measure different things. The average price is what homes in the area are currently being marketed at, taken from live listings. The percentage tracks what homes have actually sold for, per square foot. They will not match, and neither is a percentage of the other.
Report limits
- Generating a new report uses credits (see How Credits Work)
Your reports stay up to date
When a Content Pack covers a postcode you've covered before, in the same report style, it refreshes your existing report in place instead of creating another copy:
-
One report per area, per style. Your Library keeps a single up-to-date report for each postcode and style, rather than a growing stack of monthly duplicates.
-
The share link stays the same. Because each new pack refreshes the report rather than replacing it, anything that links to it (posts, emails, your bio link) shows the latest figures after every new pack you generate for that area. Reports from before this change, and areas you stop covering, keep whatever data they had last.
-
Your edits are kept. Custom call-to-action wording, email signup copy, and any sections you've hidden all survive the refresh; only the market data and commentary update.
After generating
Once your report is ready, you can:
-
Find it any time in your Library under the Reports tab
-
Share it with a public link
-
Use it as the basis for email campaigns and social media posts
-
Track who views it via Engagement Tracking
Tips
-
Reports are most valuable when they cover a specific area your agency operates in
-
Regenerating a report refreshes the market data while keeping your custom edits
-
Deleting a report from your Library stops its public link working, but any leads it captured stay safely in your Leads list