

Dashboard
Your command centre for tracking marketing activity, leads, and engagement at a glance.
The dashboard is your command centre. It gives you an instant overview of your marketing activity, lead generation, and content performance across your workspace.
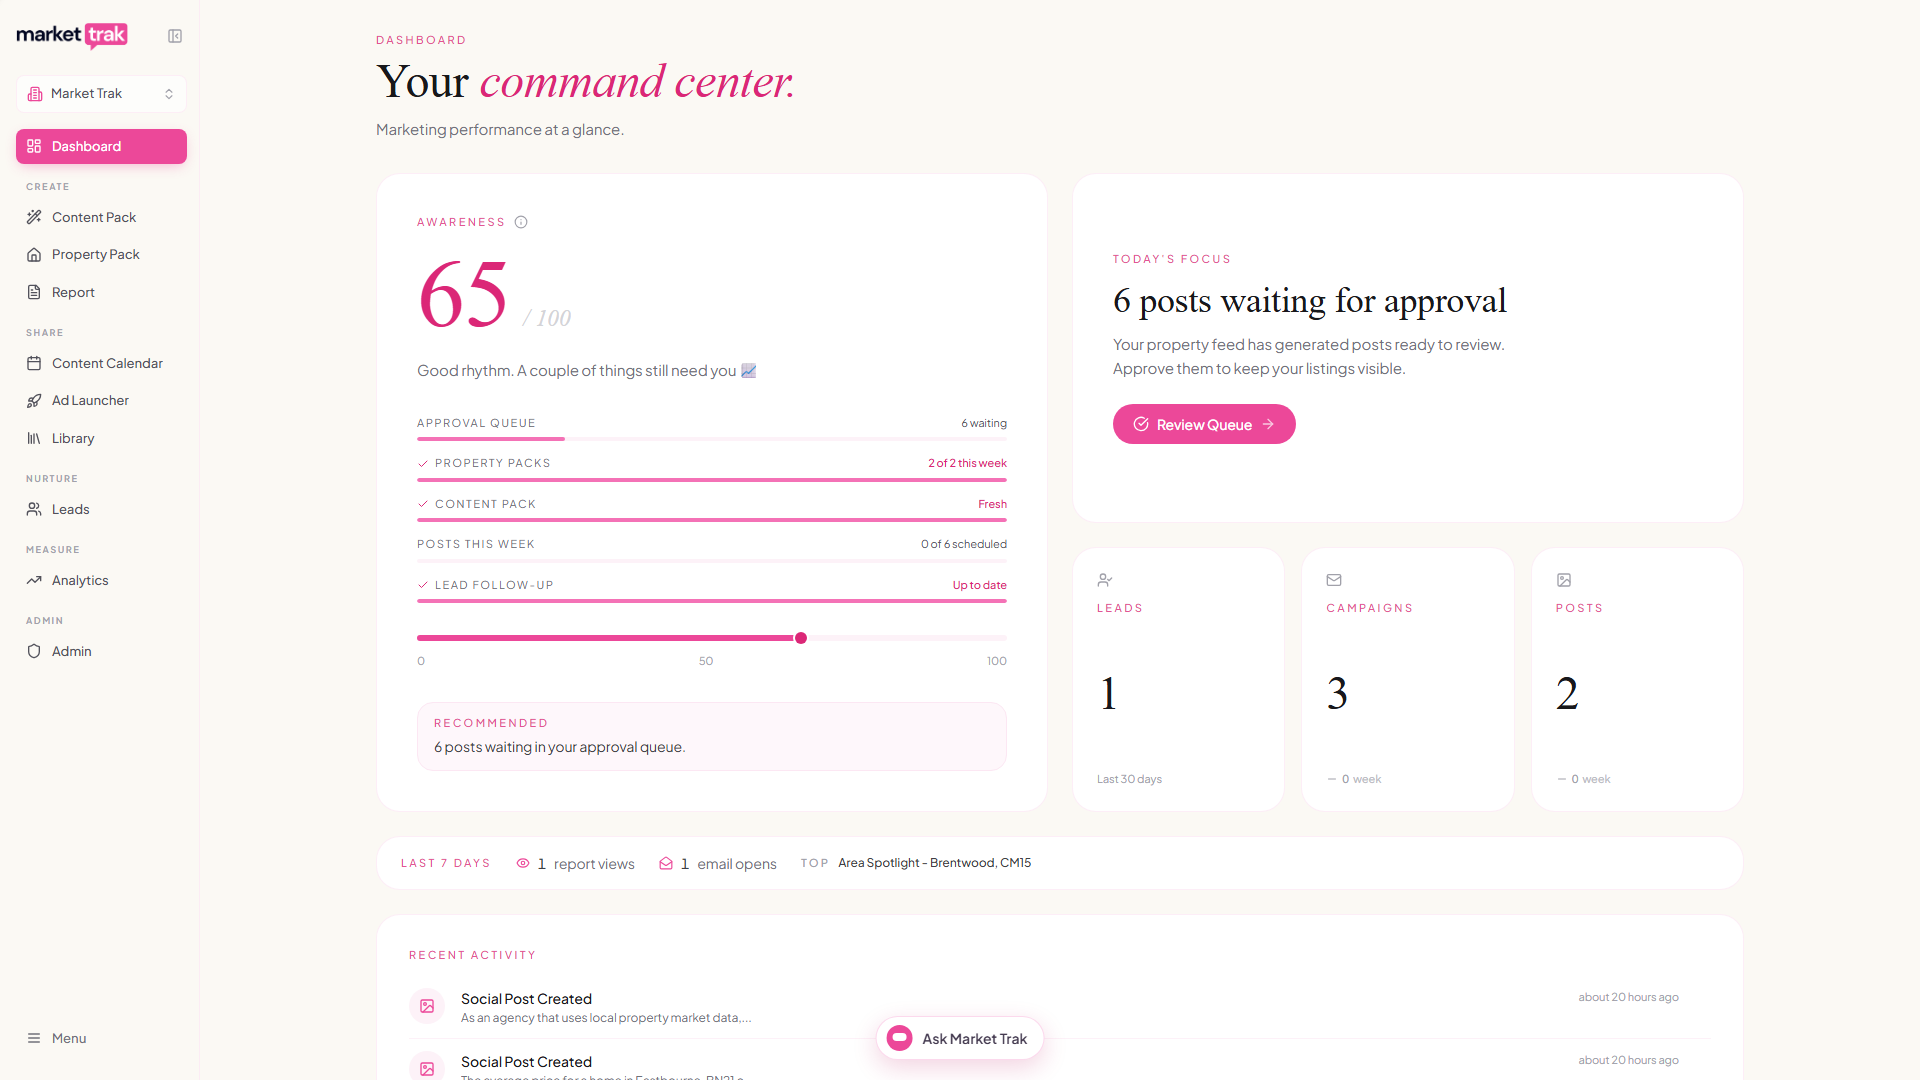
Awareness Meter
The large featured tile at the top of your dashboard is the Awareness Meter. It scores you from 0 to 100 on what is open for you right now, not on generic activity targets. The meter lists exactly what goes into your score, so you can always see why the number is what it is:
-
Property Packs - appears when new listings arrived from your feed this week. One or two packs covers the week, however many listings came in. No new listings, no row: it never asks for what you don't have. The properties already on your books when you first connected your feed don't count as new arrivals, so connecting a feed never fills this row with your back catalogue.
-
Content Pack - shows a tick for each of your postcode areas that has had a Content Pack in the last month, and asks for the area that has waited longest. If you cover more than four areas, it asks about four, so the target never grows with your plan.
-
Posts this week - six posts scheduled or published keeps you in front of your audience daily. One Property Pack produces exactly six, so a single pack fills the week. It counts the posts still on your calendar, so taking one off again lowers the row.
-
Approval queue - appears while posts are waiting for your review, and clears when you deal with them.
-
Leads to email - appears only if you have leads, and shows a tick while you have emailed them in the last 7 days. If you have never sent a campaign, or your last one was more than a week ago, it opens.
Rows with a tick are done for their window; rows with a partial bar show how far along you are. 100 means nothing is waiting for you.
If you have created posts but not yet connected a Facebook Page, your score is capped at 40 no matter what else you do. Content with nowhere to publish is the one problem that blocks everything else, and connecting your Page releases the cap instantly.
Metric cards
Below the Awareness Meter you will see quick-glance metric cards:
| Metric | What it tracks | Colour |
|---|---|---|
| Leads | Leads Market Trak captured for you | Amber/Orange |
| Campaigns | Email campaigns sent | Green |
| Posts | Posts that have published | Purple |
All three cover the same period, which is why the heading above them reads Activity, last 30 days. Campaigns and Posts also show a trend against the previous 7 days.
The Leads card counts the people Market Trak captured for you: an instant valuation, a report unlock, your Bio link, an embedded form, a Facebook or Instagram lead ad, or someone you added yourself. Leads you imported from a spreadsheet or a CRM are not counted, which is what its subtitle means by "Excluding imports". This is why the number here can be lower than the Last 30 days figure on your People page, which counts everyone who arrived however they got there.
The Posts card counts posts that have actually gone out, which is why its subtitle reads "Published". Posts sitting on your calendar waiting for their date are not counted here: you will see them on the calendar itself, and in the Posts this week row of the Awareness Meter above.
Today's Focus
The Today's Focus card shows the top item from the same list the Awareness Meter scores, one focus at a time, so the card and your score always agree. For example:
-
When a listing has arrived from your property feed or CRM, the card becomes Create a Property Pack for [address] with the listing's photo, always your most recent listing. One click opens the Property Pack builder with that property already selected, so you can turn it into posts while the listing is still news. This suggestion appears on paid plans and during the free trial.
-
Posts waiting in your Approval Queue, with a link to review them
-
Posts you have already made but not yet scheduled. If a pack left finished posts sitting on its page, the card counts them and takes you straight there, because getting what you have already written onto your calendar comes before making anything new
-
A thin week on the calendar, with a nudge to schedule more posts
-
Content going stale, with a suggestion to create a fresh Content Pack for the area that has waited longest
-
Leads that arrived since your last email, with a link to your leads page
-
If nothing is open, you will see an "All Caught Up" message, and because the card and the score share one list, that only appears when your score is genuinely 100
Engagement Snapshot
Between the metric cards and recent activity, a compact Engagement Snapshot widget shows your last 7 days of engagement:
- Report views - how many times your public reports were viewed
- Email opens - how many campaign emails were opened by leads
- Top report - the title of your best-performing report
Clicking the report views figure takes you to the reports cards on the Analytics page. Clicking email opens takes you to its email card.
The widget hides automatically when there is no engagement data to show.
Recent Activity
A timeline of your latest actions across the workspace:
-
Reports generated
-
Email campaigns sent
-
Social media posts published
-
Leads captured
Click any item to go directly to the relevant page.
Refreshing data
Dashboard metrics update automatically and cache for 2 minutes to keep things fast. If you have just completed an action (like sending a campaign) and the numbers have not updated yet, wait a moment or click the refresh button.
Changes you make in one browser tab will sync to other open tabs automatically.